Vipul Sharma, 30th Jan
What is Power BI?
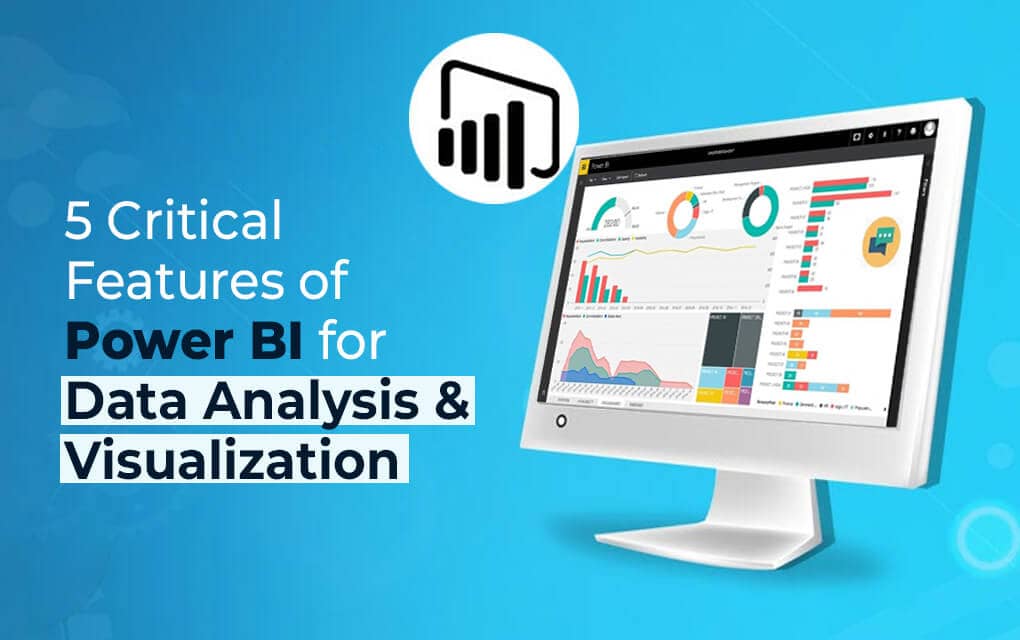
Power BI is a powerful data visualization and analysis tool developed by Microsoft. It allows businesses to connect to a wide range of data sources, create custom reports and dashboards, and gain insights from their data. In this article, we’ll introduce you to the features of Power BI for data analysis and visualization.
Table of Contents
Key Features of Power BI
1. Get Data (Data Source)
One of the key features of Power BI is its ability to connect to a wide range of data sources. This includes popular tools such as Excel, SQL Server, and Salesforce, as well as more specialized sources such as GitHub and Zendesk.
Power BI also has a robust set of connectors for popular cloud-based data platforms, such as Google Analytics and Adobe Analytics. This means that you can bring all of your data into one place and analyze it in a single tool.
2. Custom Data Visualization
Once you’ve connected to your data sources, Power BI makes it easy to create custom reports and dashboards.
The tool includes a wide range of visualizations, such as bar charts, line graphs, and pie charts, that you can use to represent your data.
You can also create custom visuals using the Power BI Visuals Marketplace, which is a collection of free and paid visualizations created by the Power BI community.
3. Robust Data Analysis
In addition to its visualization capabilities, Power BI also has several features that make it easier to analyze your data. One of these is its natural language querying feature, which allows you to ask questions about your data using plain English.
For example, you could ask “What was our total revenue last month?” and Power BI would return a chart showing your revenue for the past month. This makes it much easier to quickly get insights from your data, without having to manually create a chart or graph.
Power BI also has an AI-powered recommendation engine that can help you discover insights you might have missed.
By analyzing your data and your past actions in the tool, the recommendation engine can suggest charts, graphs, and other visualizations that might be of interest to you. This can be a great way to uncover patterns and trends in your data that you might not have noticed otherwise.
4. Extensive Accessibility
Another key feature of Power BI is its mobile app, which allows you to access your reports and dashboards on the go. The app is available for iOS, Android, and Windows devices, and includes many of the same features as the desktop version of Power BI.
This means that you can stay up-to-date with your data even when you’re away from your desk.
5. Integration
In addition to its core features, Power BI also has several integrations with other Microsoft tools, such as Excel and Azure. This can make it easier to work with your data in a seamless, integrated way.
For example, you might use Power BI to create reports and dashboards based on data stored in Excel, or you might use Azure to store and process large amounts of data for use in Power BI.
Conclusion
Overall, Power BI is a powerful tool for data visualization and analysis. Its ability to connect to a wide range of data sources, create custom reports and dashboards, and gain insights from your data makes it a valuable tool for businesses of all sizes.
Whether you’re a small startup or a large enterprise, Power BI can help you make better, more data-driven decisions. Contact us to set up a powerful Power BI dashboard and boost your organization’s performance.

