Vipul Sharma, 23rd Jan
Your company’s website is a need for operating a business in 2023. For your clients to be able to learn more about your product or service and discover a means to contact you, you must have a website.
Many website owners are interested in learning about the metrics and statistics for their websites using this resource. They want to get the answers to crucial issues like how many people are visiting my website or how they found it. Google Analytics is the finest and most often used tool for this. Today’s businesses may benefit from the vast quantity of data that Google Analytics can offer. Finding insights might be difficult because the gathered website data can be raw.
Connecting Power BI to Google Analytics can be useful in business intelligence because it allows you to analyze and visualize data from your website and other channels.
Table of Contents
What exactly is Google Analytics?
Google Analytics is a vital tool that measures website activity and is available for free. You need to create an account and upload the tracking code to your website in order to use the service. Monitoring your website traffic is essential if you want to know who is visiting it, how they found it, and what they do when they get there.
What is Power BI?
The best business intelligence product from Microsoft is called Power BI. In order to model and display data in a report-ready manner, it is utilized to connect data sources.
The most significant advantage of combining Power BI to Google Analytics is compiling data from several sources into one.
Concept of ‘Power Analytics’: Google Analytics + Power BI
Google Analytics is one of the most well-liked website performance monitoring tools businesses use to assess their progress toward online marketing objectives. It helps digital marketing teams learn more about their target audience’s navigational habits and preferred engagement methods. Businesses may also see which search phrases brought people to their website, which articles and pages drew the most attention, and what proportion of people clicked on a call-to-action.
Combination of Power BI & Google Analytics in Business Intelligence
Most businesses utilize Google Analytics to see whether their marketing goals are being met and to learn about potential website performance adjustments.
However, using Google Analytics data in Power BI can find unnoticed links or trends that hint at new prospects or offer creative marketing ideas and strategies for luring in new clients.
Google Analytics does a superb job of monitoring website user behavior, including the number of unique page views, the length of time spent browsing, and the geography of visitors.
However, Google Analytics only provides a few analytical tools for tying marketing data to data from other departments or to patterns in external data that are affecting the market.
That is the value that Power BI adds.
With Power BI, you can contrast Google Analytics data on online performance with information from both internal and external sources. Import data from Exchange, Facebook, Wikipedia, and Data.gov, as well as HDInsight, Azure Marketplace, and Marketplace. Compare the data you import from Salesforce, Marketo, or other sources to the online performance statistics. Give your co-workers the tools they need to see your organization’s performance more comprehensively.
Its dynamic visualization features make Power BI so appealing to many users. It is fantastic to track the performance of your website over time, but seeing data come to life in real-time and reveal a variety of trends and correlations has a lot of wow factor.
For instance, think of the map visualizations in Power BI. They allow you to monitor the countries from which visitors to your website originate. You have the option to dive down for additional information if a place catches your attention.
Observe a rise in website traffic at a particular time and location. Pinpoint the position by enlarging. Cross-reference the time and location with recent occurrences.
Was there a local conference or a sales announcement that caused the increase in traffic? With this knowledge, you will be better able to predict when users will visit your website, allowing you to offer timely and pertinent material to spark interest in your goods or services.
How to Connect Power BI to Google Analytics?
Connecting Power BI to Google Analytics allows you to access this data and use it to gain insights and make data-driven decisions about your business.
Once you download the PowerBI through Microsoft or through Microsoft Store. To connect Power BI to Google Analytics, you can follow these steps-
- Open Power BI and click the “Get Data” button in the “Home” tab.
- From the “Get Data” menu, select “Online Services” and then choose “Google Analytics“.
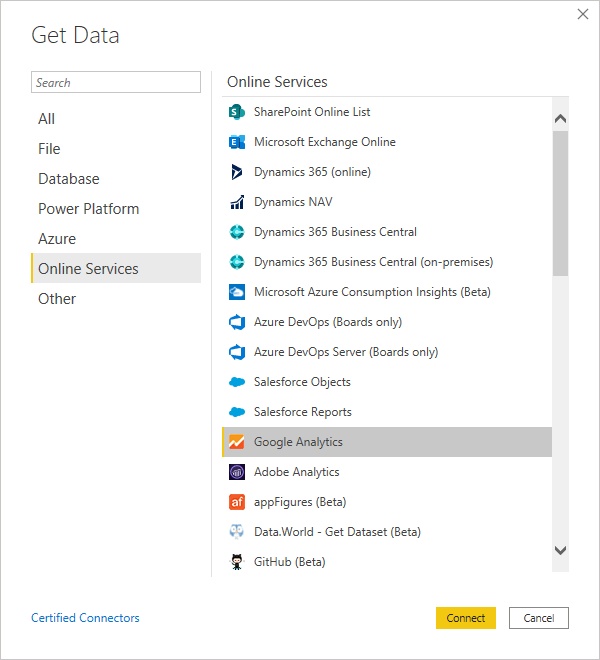
- Click “Connect” to open the Google Analytics connection window.
- If prompted, sign in to your Google account.
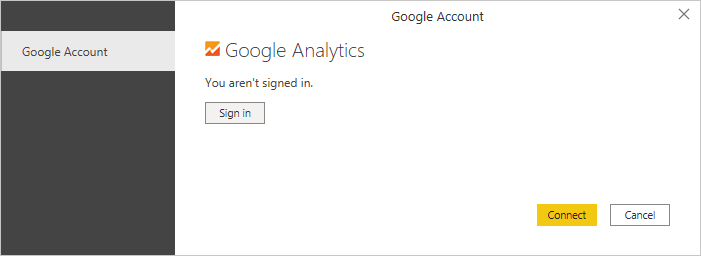
- In the “Google Analytics” window, select the account, property, and view you want to connect to.
- Click “Connect” to import the data into Power BI.
- If necessary, enter the credentials or connection information required to access the data source.
- Once the data is imported, you can use Power BI’s visualizations and tools to analyze and explore the data.
Additionally, you can import Google Analytics data into Power BI Desktop (formerly Power BI Designer)-
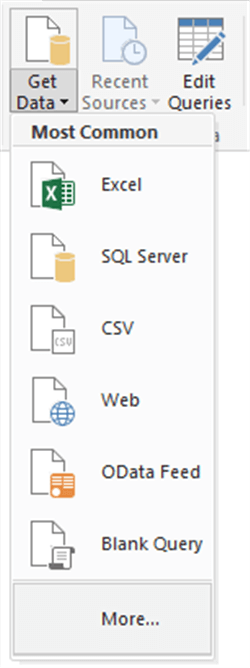
- After launching the Power BI desktop, click “Get Data” in the external data group on the ribbon.
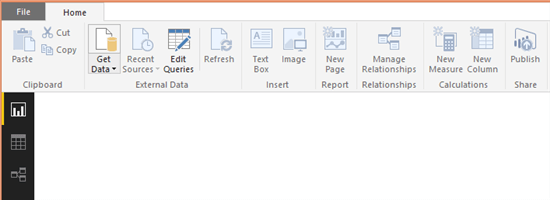
- Click more from the drop-down menu.
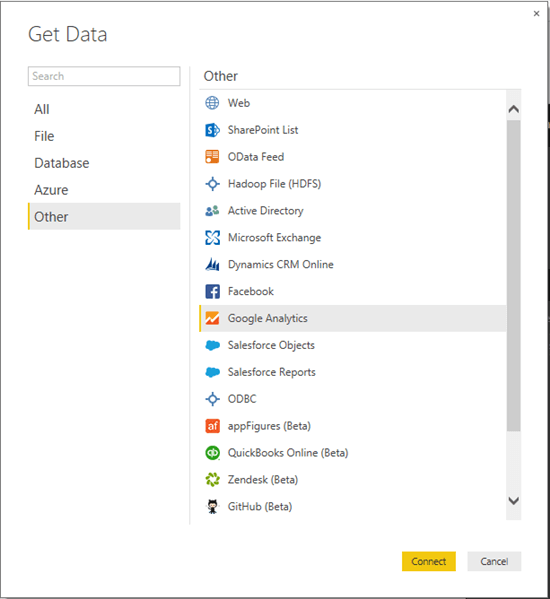
- Click Other in the Get Data window. Select Google Analytics from the list of additional data sources, and then select Connect.
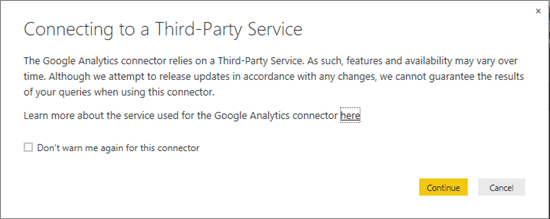
- Click Continue after reading the information about connecting to a third-party service.
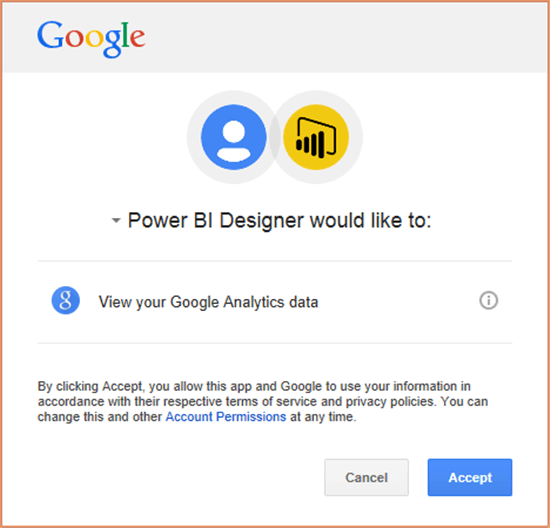
- Power BI Desktop requests authorization from Google Analytics to connect to your data. To accept, click.
- Power BI Desktop shows that you are signed in to Google Analytics. To load your Google Analytics data, click Connect.
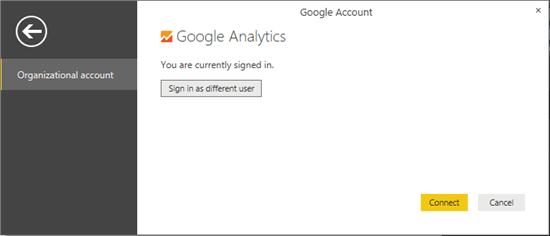
- You are logged into Google Analytics, according to Power BI Desktop. Click Connect to load your Google Analytics data.
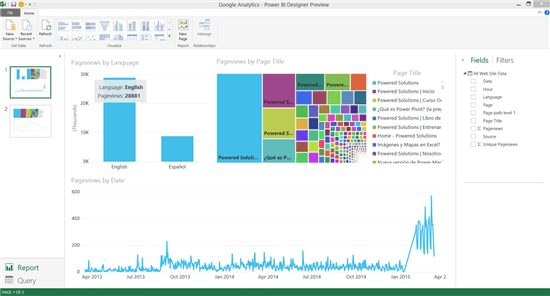
- The Google Analytics data is loaded into Power BI Desktop. You may now begin generating your incredible dynamic reports.
Benefits of Connecting Power BI to Google Analytics
Once you have connected Power BI to Google Analytics, you can use the data in a variety of ways. Here are a few examples of how you can use the data:
- Create visualizations: You can use Power BI’s visualization tools to create charts, graphs, and other visualizations based on the data from Google Analytics. This can help you understand trends, patterns, and other insights about your website or online business.
- Use data filters: You can use data filters to focus on specific segments of your data, such as traffic from a specific country or a specific type of device.
- Use DAX formulas: You can use DAX (Data Analysis Expressions) formulas to create calculated columns and measures based on the data from Google Analytics. This can help you perform complex calculations and analyze the data in new ways.
- Create reports: You can use Power BI’s report creation tools to create interactive reports based on the data from Google Analytics. These reports can be shared with others and used to track key metrics and performance over time.
- Use dashboards: You can create dashboards in Power BI that display important metrics and visualizations from Google Analytics in a single, easy-to-use interface. This can help you quickly see how your business is performing and identify areas for improvement.
Final Words
Connecting Power BI to Google Analytics can be a valuable part of your business intelligence strategy because it allows you to access, analyze, and visualize data from your website or online business in a powerful and flexible way.
Anyone may connect to enormous volumes of organized and unstructured data from many sources thanks to Power BI. Organizations may see how well their website is performing concerning a variety of other factors by including data from Google Analytics.
With the help of Power BI, you can manipulate this data, visualize it, and share it with your co-workers. With the correct tools to analyse and interpret them, the more data sources you have, the more probable it is that significant insights will surface. Your data from Google Analytics has now been successfully integrated to Power BI. You may now develop your computations and metrics to address your website analytics queries from this point on.
The next step is to create a stunning dashboard with visualizations that put the data you need in your fingers.
Contact us to know how you can utilize the full potential of Power BI to analyze your organization’s data effectively.