Vipul Sharma, 20 July
Table of Contents
1. Understanding KPI Dashboards
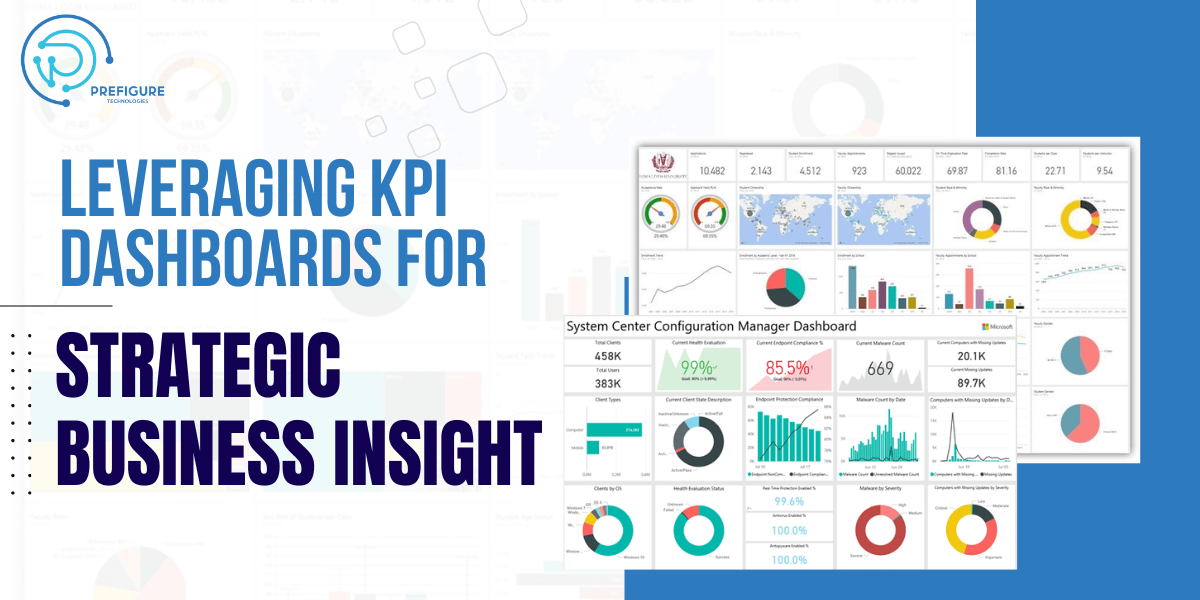
KPI dashboards are beneficial tools that bring together all the important data of your business and display it visually. These dashboards offer a convenient and instant way to see how well your business is performing against your chosen key performance indicators (KPIs).
2. Advantages of a Robust KPI Tool
A KPI dashboard benefits its users by:
- Simplifying the tracking of KPIs and other important business metrics.
- Providing a combined view of all data to improve understanding of business health.
- Allowing personalized data visualization with performance and status indicators.
- Using the same tool or platform for creating your KPI dashboard and defining your KPIs ensures all your data is housed in one place. This makes updates more efficient and saves you time and effort.
3. What is a KPI?
A KPI or key performance indicator is a measurable factor that shows how effectively your business is achieving its objectives. Consider KPIs as your company’s performance report card.
a. Importance of KPIs
KPIs, when used correctly, are powerful tools that assist you to:
- Keep track of your company’s financial health.
- Measure progress against strategic goals.
- Identify issues at an early stage.
- Make necessary adjustments in strategies promptly.
- Motivate team members.
- Make informed decisions quickly.
- To choose the right KPIs for your business, start by defining your strategic objectives. These objectives will guide you to identify KPIs that are relevant to your business. Then, define the KPI targets you aim to achieve, keeping in mind that these could be either short- or long-term targets.
Encourage discussions with your team about the chosen KPIs and their targets. Check if the targets are achievable and not solely based on factors outside your team’s control. Remember to also discuss strategies for achieving these targets and evaluate your current status.
b. Understanding Different Types of KPIs
Knowing the different types of KPIs can make it easier to choose the ones you should track:
- Quantitative KPIs: These are measurable facts that can be represented with a number, like statistics, percentages, etc.
- Qualitative KPIs: These are based on human interpretations and cannot be quantified with numbers, like opinions, feelings, etc.
- Lagging KPIs: These measure past performance to predict success or failure.
- Leading KPIs: These measure current performance to predict future success and trends.
- Assign an owner for each KPI you decide to track and determine how often you will track it. Using a KPI platform or tool for this purpose can aid collaboration within your team on KPI definitions and enable timely actions based on real-time data.
C. Examples of KPI Dashboards
Effective KPI dashboards visually represent all your relevant metrics in one place. They can cover various areas like marketing effectiveness, customer service, financial health, and IT performance. Each of these areas will have its own relevant metrics that you might want to track.
d. The Power of KPI Reporting
KPI reports take the data from the dashboard and provide a deeper analysis. These reports help stakeholders and team members identify trends or problems over a specific time period, enabling better decision-making. When creating your KPI report, keep in mind your audience and the report’s objective. Ensure the KPIs in your report align with this objective. Regularly schedule your reporting and make it clear, easy to understand, and actionable for your audience.
e. Best Practices for KPIs
Here are a few tips to successfully use KPIs:
- Select KPIs that align with your specific goals.
- Use different KPIs for different departments, as their goals might differ.
- Assign a dedicated team for defining your KPIs.
- Determine a regular schedule for monitoring and taking actions based on KPIs.
- Ensure the safety of your data dashboards, with controls for sharing data outside the organization.
- Common KPI Mistakes
4. Avoid the following common mistakes when working with KPIs:
- Selecting KPIs that don’t align with your strategic goals.
- Having vague or poorly defined KPIs.
- Setting unrealistic KPI targets.
- Having KPIs without a responsible owner.
- Failing to act based on your KPIs. Remember, KPIs are meant to guide you in making better decisions, so always take action based on their results.
5. Conclusion :
In conclusion, understanding and implementing KPI dashboards is crucial for any business looking to stay on top of their strategic objectives. They provide valuable insights, simplify decision-making, and ensure transparency across all business operations. A well-designed KPI dashboard not only helps in monitoring your company’s financial health but also motivates team members and fosters a culture of constant improvement. However, the true power of KPIs and KPI dashboards lies in how effectively they are employed.
It’s essential to avoid common mistakes such as setting unrealistic targets or not taking action based on the insights provided. Remember, KPIs are not just about tracking; they are strategic tools that can drive your business toward its goals when used properly. As you progress on your journey, continue refining your KPIs, adjusting your targets, and evolving your strategies for an increasingly resilient and successful business.

