Vipul Sharma, 23rd Feb
Table of Contents
Companies today create and consume data at dizzying speeds. Furthermore, to outperform one another, these companies rely on Data Analytics to interpret their massive amounts of data and extract some meaning from it.
Organizations then use the outputs of Data Analytics to formulate and execute data-driven business choices. This procedure, however, is more complex than it seems because businesses keep their data in numerous sources in a decentralized fashion.
In such cases, organizations look to Business Intelligence (BI) products like Power BI to help them manage their data more effectively. Power BI delivers simple solutions for activities involving data analytics and visualization.
Furthermore, it has capabilities that organizations may use to optimize their data-related operations. The whole list of DAX functions in Power BI.
1. What are the DAX functions in Power BI?
DAX (Data Analysis Expressions) is a significant function package that helps Power BI users simplify their jobs. Furthermore, DAX allows users to construct dynamic Data Management and do complex mathematical and logical activities with a few mouse clicks. In this way, the DAX library improves users’ Power BI experience.
This article describes Power BI and DAX and their essential features. It also goes through the different sorts of DAX functions In Power BI. It will also show you the advantages of utilizing DAX Functions.
DAX is an abbreviation for Data Analysis Expressions, expressions, or formulae used for data analysis and computations. These expressions are composed of functions, operators, and constants evaluated as one formula to produce results (value or values).

DAX formulae are highly valuable in BI solutions like Power BI because they allow data analysts to make the best use of their data sets. Analysts may use the DAX programming language to explore new ways to calculate data values and get new insights.
Let us go through some crucial elements regarding DAX to assist you in comprehending the concept better:
- DAX is a functional language whose whole code is always a function. A DAX expression that may be executed can include conditional expressions, nested functions, value references, etc.
- DAX formulas have two basic data kinds: numeric and non-numeric or Others. Integers, decimals, currencies, and other numerical data types are examples of numeric data types. Strings and binary objects are examples of non-numeric data.
- DAX expressions are evaluated starting with the innermost function and progressing to the outermost one at the end. This emphasizes the need to develop a DAX formula.
2. Importance of DAX Functions In Power BI
It is normal to wonder why DAX is crucial to grasp and operate correctly with Power BI. Creating reports in Power BI utilizing data importing, processing, and visualizing features is accessible.
A user must have a basic understanding of Power BI Desktop to build a good report with all the access data. However, DAX is required if you wish to develop and employ complex calculations in your Power BI reports.
Assume you want to create a graphic to compare year-over-year growth/sales or to evaluate growth percentages across different states of a country. It would help if you made new measurements in the DAX language for this. This allows you to construct new measures, utilize them to generate innovative visualizations, and get new insights into data.
With such unique insights into data, you might have appropriate answers for business challenges you could overlook using the traditional analysis method. As a result, DAX makes data analysis with Power BI smart and intelligent.
3. Benefits of DAX in Power BI
Power BI itself has some fantastic features. Implementing DAX Functions in Power BI, on the other hand, will take you a step further and give you the following benefits:
Many complex Power BI functions may be used using the DAX library. For example, you may dynamically change your data with DAX by utilizing select, join, filter, and many other functions.
Users may add data to your Power BI dashboard in this manner, and it will dynamically produce data, including Calculated Columns, Tables, and Measures.
You can make your Power BI Dashboards savvier by using DAX. This is accomplished by constraining the data your Dashboard will retrieve and show using Calculated Columns and Measures in Power BI.
A well-written DAX expression can reduce latency and finish data processing while working with restricted resources.
DAX works with a set of nested filter contexts to maximize efficiency. Working with DAX Functions will therefore affect your thinking pattern when it comes to tables and data filtering.
Your DAX experience will improve your thinking and help you identify better ways to integrate, filter, and manipulate data with Power BI and other tools.
4. Why use DAX in Power BI?
While DAX may appear intimidating at first, its versatility and Power make it an indispensable tool for every Power BI user. You can unleash the full potential of Power BI and build brilliant data visualizations by learning DAX.
Anyone who wishes to undertake complex data analysis should use DAX with Power BI. You may go beyond basic visualization using DAX to reveal hidden insights in your data.
For example, DAX may assist you in creating cleverly calculated columns to improve analysis efficiency and make data more uncomplicated, beautiful, and easier to understand.
Dynamic columns, tables, and measurements also assist you in better understanding, visualizing, and thinking about how to filter, combine, and alter data appropriately.
5. How does DAX operate?
DAX operates based on three main concepts: Syntax, Context, and Functions.
These inputs are critical in developing a specific command that returns desired outcomes.
- Syntax: The components of the formula you are creating are referred to as syntax. It refers to the language used in the formula, such as the command, sign, operators, destination column, row, table, and so on. For example, name, parenthesis, summation, table name, and so on.
- Context: The target row included in the formula for data retrieval or computation is referred to as the context. Context comes in two varieties: Row Context and Filter Context.
- Functions: Functions are pre-set or pre-existing commands in the system. For instance, Sum, Add, True, False, and so on.
In Power BI, DAX equations are typed into the formula bar below the ribbon. Begin by naming the formula, followed by the equal-to symbol (“=”). Then, using functions, constants, or strings, enter your formula.
DAX Functions
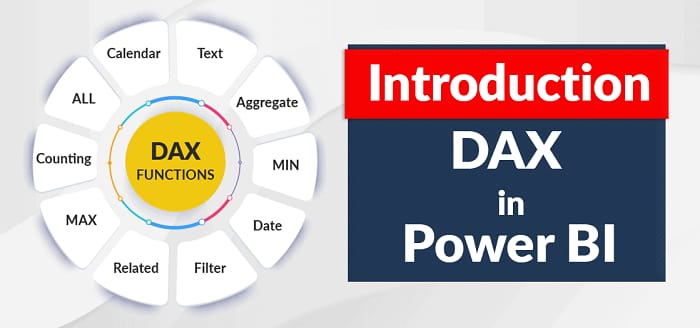
You may use several function types in Power BI to analyze data and generate new columns and metrics. It comprises functions from several categories, such as:
- Aggregate
- Text
- Date
- Logical
- Counting
- Information
Power BI makes it simple to get a list of all functions. When you enter your function in the formula bar, a list of all functions beginning with that alphabet appears.
1. Aggregate Functions
DAX has several aggregate functions.
- MIN
- MAX
- AVERAGE
- SUM
- SUMX
2. Counting Functions
Other counting functions in DAX include −
- DISTINCTCOUNT
- COUNT
- COUNTA
- COUNTROWS
- COUNTBLANK
3. Logical Functions
Following is the collection of Logical functions −
- AND
- OR
- NOT
- IF
- IFERROR
4. TEXT Functions
Below are the text Functions-
- REPLACE
- SEARCH
- UPPER
- FIXED
- CONCATENATE
5. DATE Functions
Here are the date functions-
- DATE
- HOUR
- WEEKDAY
- NOW
- EOMONTH
6. INFORMATION Functions
Below are the Information functions-
ISBLANK
ISNUMBER
ISTEXT
ISNONTEXT
ISERROR
Summary
These days, DAX is one of the most widely used expression syntaxes, with a wide range of applications. Learning it provides various industry prospects, particularly in SQL-enabled businesses. With DAX in Power BI, you may create any logical expression or formula you need.
To generate more extensive and complex reports, use Power BI’s existing columns and tables to create any logically sound DAX formula.
Prefigure Technologies helps healthcare, financial and retail companies understand their data and make informed decisions through business intelligence. Contact us to make a robust PowerBI dashboard for your organization.

