
Vipul Sharma, 26th Sep
Business intelligence, or BI, is the practice of collecting and analyzing data about your business. This can be used for everything from understanding how to optimize your current processes to spotting new trends and opportunities that could help your company grow. In this guide, we’ll cover what BI is and why it’s important to your business, what types of tools you can use with BI software, and how those tools work together to help you analyze data—whether that’s a few dozen leads or thousands upon thousands of records.
Table of Contents
What is Business Intelligence?
Business Intelligence, or BI, is a set of tools and techniques that help you make better decisions. It’s a way of collecting, analyzing, and delivering data to help you make better decisions.
BI can be found in any type of business—from small companies to large corporations—using any kind of technology (cloud or on-premises) and implementing it in different ways. For example, you can use BI to analyze data from your company’s website or mobile app usage patterns; track customer purchases; monitor employee performance; determine which products/services are selling well; forecast future demand for products/services based on sales history over time; determine which employees perform best based on certain criteria, etc…
Business Intelligence Definition
Business Intelligence (BI) is the process of collecting, analyzing, and reporting data to help an organization make better business decisions.
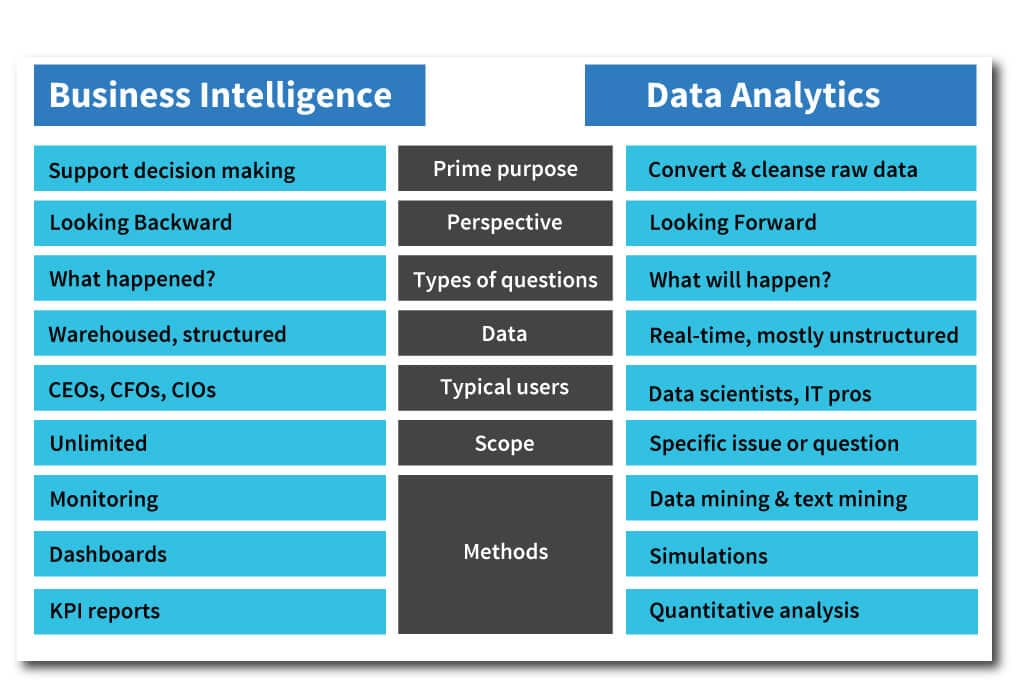
What is the difference between Business Intelligence and data analytics?
BI is a subset of data analytics, which is a subset of data science. This means BI can be thought of as BI and Analytics together, or just Analytics (the two terms are used interchangeably). Likewise, the terms are often used interchangeably with business intelligence (BI). When you see this term used in combination with other words such as “and”, “and analytics”, or “analytics and” you can safely assume it’s referring to traditional BI practices rather than modern data science/analytics approaches.
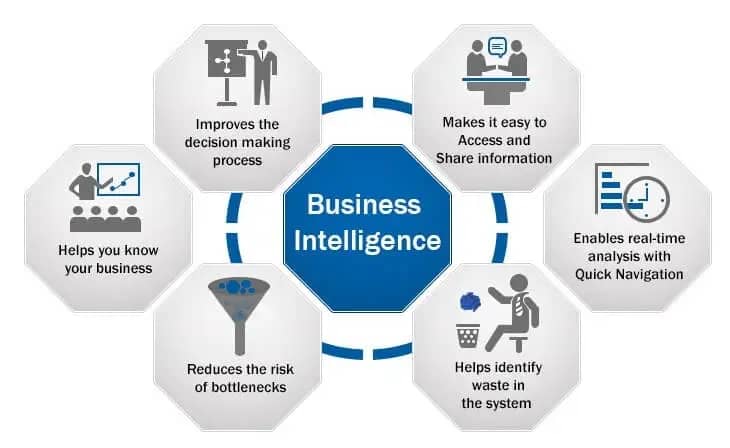
Why is BI Important?
Why Business Intelligence?
BI is important because it helps organizations make better business decisions, improve the bottom line and improve the customer experience. This can be achieved using predictive analytics and machine learning technologies which reveal insights into your data that were previously unknown or even invisible to you.
Types of BI Tools and Software and How They Help Your Business
BI tools and software can be divided into several categories, depending on the type of data they allow you to analyze and visualize. For example, if your business is looking for insights that will help it make better decisions in the future, then data discovery is probably a good fit. If you’re not sure what this entails or if you need some more information about other types of BI tools, keep reading!
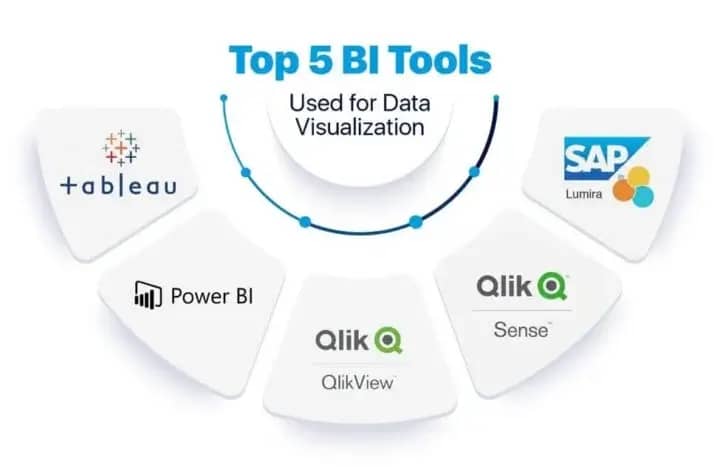
Business Intelligence tools for Data visualization
Data visualization tools like Tableau or Power BI allow users to easily create charts, graphs, and dashboards from various types of data sources (e.g., spreadsheets, and databases). These visualizations make using BI software easier because they show how different factors affect one another at a glance instead of requiring someone who knows SQL query language to write up complex queries for each report request.
For example: suppose you have several years’ worth of sales data stored on your laptop but don’t know how much revenue was generated each month last year, All it takes is one click from within Tableau’s user interface before seeing all this information clearly displayed so anyone could understand what happened during any given period without having any prior knowledge about it beforehand!
If only all our problems were solved by looking at pretty pictures…
Business Intelligence Software for Data Discovery
Data discovery tools are applications that help you find, analyze and visualize your data. Data discovery can help you find the right data to answer a question or solve a problem. It can also help you find trends in your data so that you can make better decisions and create more effective business processes.
Business Intelligence Dashboards
Dashboards are a visual representation of data. They’re used to monitor performance, so they’ll typically show KPIs and metrics that matter to the company. This helps you keep track of how well you’re doing against your goals, as well as identify any areas where things aren’t going according to plan.
Data Analysis
Some of the most popular BI tools are statistical analysis software packages like SPSS, SAS and Minitab. These tools allow users to perform statistical tests on their data sets in order to analyze them scientifically or statistically. This can be very useful for determining how different factors affect each other in your company’s business environment. For example: If you want to know if there’s a correlation between customers using an app frequently and them signing up for new services offered by your company (and whether this increases revenue), then you could use a statistical analysis tool like SPSS or Minitab on your customer database. These tools would allow you to determine whether there is indeed such a relationship between these two variables! Data mining applications like Rattle also fall into this category–they let users explore databases using visualizations that make it easy for anyone with no knowledge about statistics (or even programming) to run those reports themselves.
Data Warehousing Solutions, OLAP (Online Analytical Processing), and Big Data Analytics Tools
Data warehousing solutions, OLAP (Online Analytical Processing), and Big Data Analytics Tools are used to analyze large volumes of data.
OLAP is a data warehousing solution used to analyze large volumes of data. It’s used primarily by business analysts and decision-makers who want to summarize and compare different aspects of the business at a glance.
It provides users with an interactive interface that allows them to manipulate the data using multidimensional cubes or dimensions. This helps users visualize their information in different ways by arranging it in multiple “dimensions” like time or geography; rather than just one single table or spreadsheet showing all columns/rows as they would appear if you were looking at them on paper without any formatting applied at all (e.g., bold text).
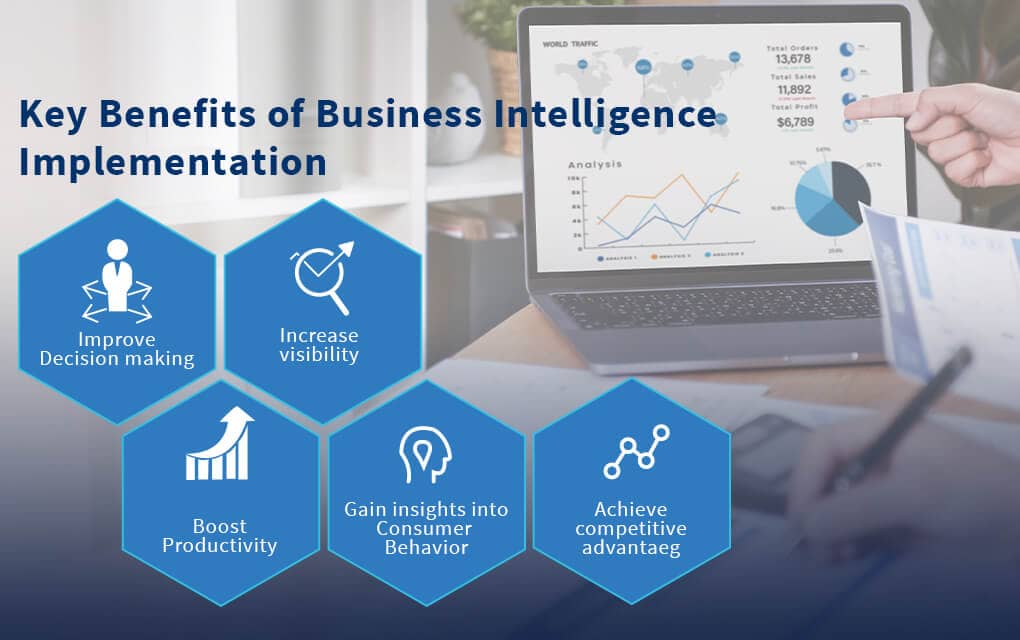
Business Intelligence can Help your Company Grow
- BI can help you make better decisions.
- BI can help you predict future trends.
- BI can help you improve your business processes.
- BI can help you make better use of your data.
- BI can help you improve your customer experience.
- BI can help you improve your marketing.
Conclusion
We hope that this article has given you a good understanding of what business intelligence is and how it can help your company grow. If you want to learn more, check out our other articles on the topic. Prefigure Technologies based in Seattle specializes in Business intelligence (BI) services. We offer services to design, develop and deploy enterprise processes and to integrate, support, and manage related technology applications and platforms. These include business and infrastructure applications for BI platforms, analytics needs, and data warehousing infrastructure. Solutions include areas such as corporate performance management (CPM) and analytics, in addition to the traditional BI platform, data warehouse/data infrastructure, and data quality areas.